Iceberg systems mapping tool to identify leverage points for change
When tackling a complex challenge we need both a thirty thousand feet view and on the ground insights from people struggling with a challenge. Systemic Design is a way of problem solving that strives for a both-and approach- Systems Thinking for looking at the big picture and Design Thinking to learn from lived experience in order to identify needs, pain points and desires of people making up a complex system.
Below we are sharing the Iceberg Systems Mapping canvas and general instructions for use. This particular Iceberg canvas was developed by Ben Weinlick and Jaime Calayo and remixed from theories and practices of systemic design. As with any systemic design tool beware of using it as a rigid template. Adapt the instructions to each context you apply it in and leave some room for participants to have to embrace ambiguity and uncertainty.
IceBerg Tool with Z.I.P Analysis
Downloadable PDF Iceberg_Model_Poster_5 feet by 7 feet
Downloadable Z.I.P. Analysis Stickers for the converge phase
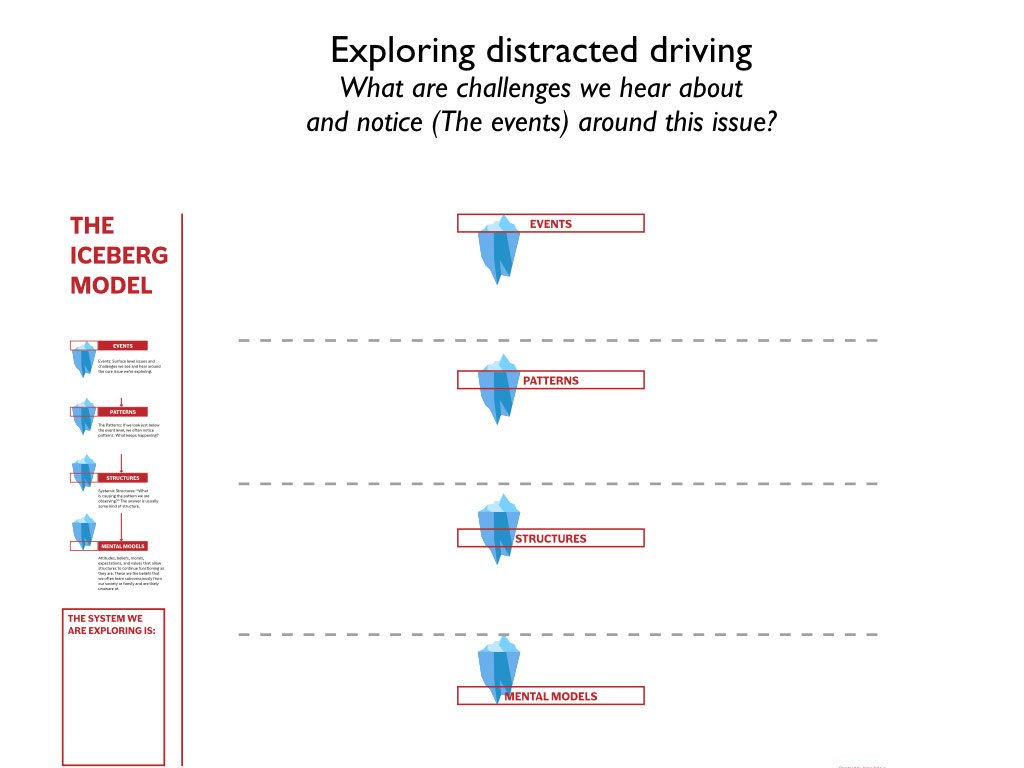
What is it: A Systems thinking tool that helps a group make sense of a tough challenge together. The tool helps them dig into possible underlying structures and root causes of a challenge. This is not an ideation tool, but more a sense making tool that helps a group align with what an issue is and entry points for change. The iceberg systems thinking tool is useful especially when exploring an issue with groups of people who's minds generally lean toward critical thinking, and reasoning. We often use it when working with engineers, and business minded folks. The trick is, you want to stretch people out of their comfort zones to see things differently, but you don't want to stretch so much that they check out and can't relate. The 4 levels explored through the iceberg are the Events, Patterns, Systemic Structures and Mental Models that underlie a system.
Set up: Allow at least 1.5 hours. Groups of 5-9 people per team. 1 poster per team. Not a great idea to have groups bigger than 10 people. If you have 80 people, then you need 8 groups, 8 posters. Download and print the poster 5 feet by 7 feet. Get a stack of sticky notes and a bunch of sharpies. Have the overarching frame generated and two conversation questions ready as entry points. Have Z.I.P. analysis stickers printed. Or use small colored sticky note tags that you mark ahead of time. Each team will need 9 stickers total. 3 marked with a Z. 3 Marked with an I and 3 marked with a P. It's a good idea to color code the ZIP tags.
Four Phases: Phase 1 is a couple rounds of conversation with no writing or mapping. This primes a group to enter the system frame. The 2nd phase is the main part and is about mapping the system in a divergent way. Team members write up sticky notes and place them on the iceberg map where they feel they go. The 3rd phase is the convergent thinking phase where participants identify leverage points for change through tagging areas on their map with the ZIP stickers. The 4th phase is a debrief of what was learned, insights and now what-so what.
Steps
2 mins -Give the overarching framing of the system they will explore and set the ground rules for engagement.
16 mins - Have teams go through 2 -8 min rounds of conversation. It may be something like, what's working well in the system you're exploring? and what's not working so well?
30 mins - Get teams to stand up and go to their maps. Have sticky notes and sharpies in hand. They can start anywhere, have them discuss the events, patterns, structures and mental models of the system they're exploring. If participants put vague one word answers on a sticky, have them put in a little bit more context, but warn them not to write a book on the sticky note. Teams chat, write, and move around the stickies as they make sense together of the system.
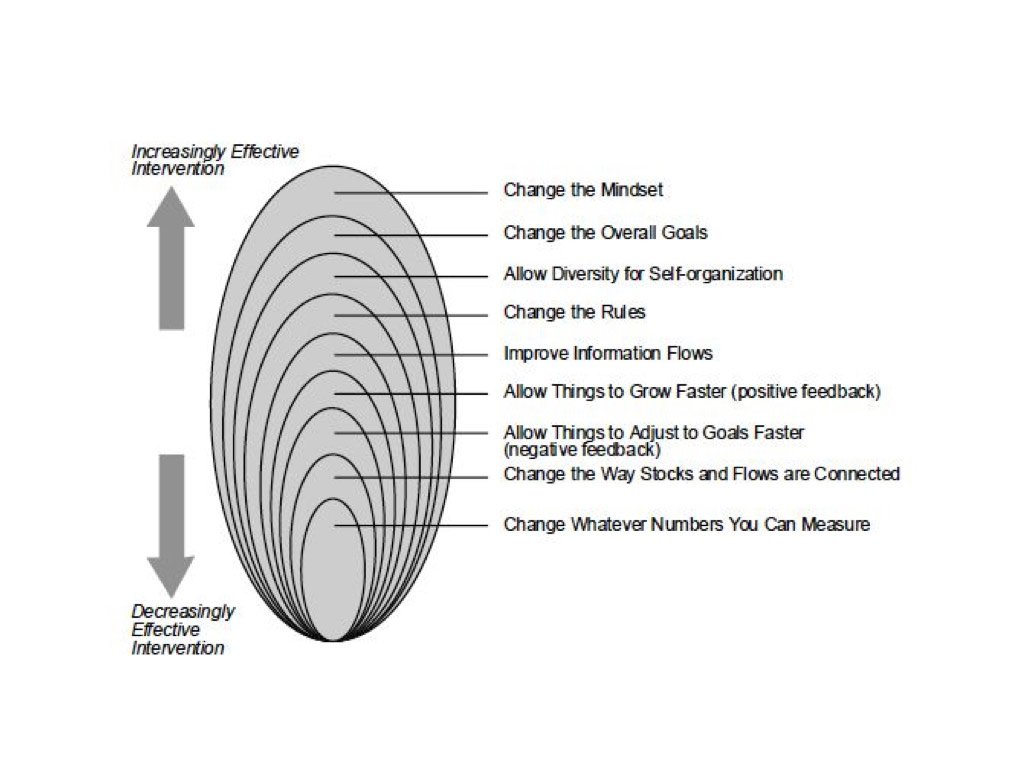
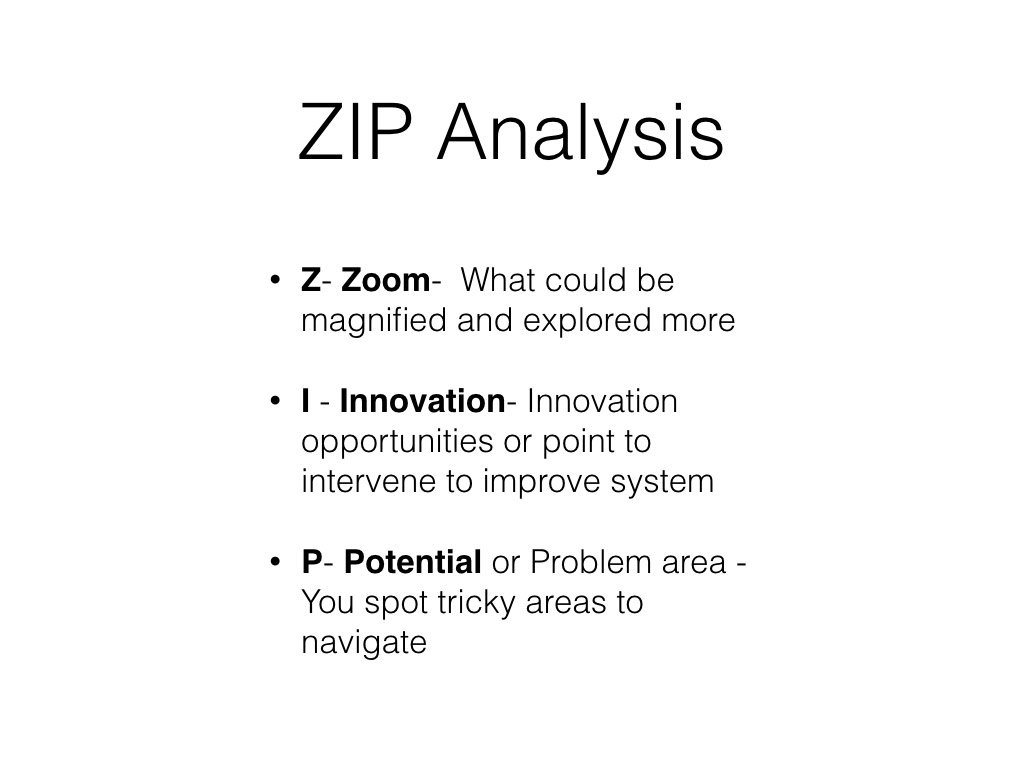
15-20 mins - ZIP analysis. Now you hand out the stickers - 3 marked with a Z. 3 Marked with an I and 3 marked with a P. You instruct the teams to together identify points in the system where they feel there are leverage points. They tag 3 areas anywhere on the map with a Z. Zs- are areas to Zoom in and magnify more. I - areas are innovation opportunity areas. P- areas are places that are flagged as quite tricky to navigate and be extra aware of. After they identify their ZIP area, have someone on each team write what the ZIPs are on the bottom left corner area of the canvas. Writing them down helps everyone to remember them for later because their maps will be quite messy and hard to decipher later on.
5 mins- Debrief and insights. You might get team members to share their most significant insight from the activity or ask them to discuss what surprised them the most.
3 mins - Now what-So What! - The ZIP analysis from teams can be great to theme and transform into How Might We statements where further Design work can be done to prototype and test interventions. If you have a large group and many maps each with their own ZIP analysis' then you might want to convene a group to theme the ZIPs before coming up with How Might We statements.
Tips and improvisations
Tip from Roya Damabi of the Alberta CoLab - If participants talk too much in phase 2 and don't write any stickies, then have them pause for a moment and you say "Ok folks, everyone needs to be quiet for 3 minutes and everyone needs to write and place as many stickies as they can on the map" after the 3 minutes have them describe to each other what they wrote down.
Mid way through phase 2 you may interrupt with a "Think Jar" or provocation. You might say something like, "Who has ultimate authority in the system? What has to be true to make this system do what it does? What is a story you have that highlights a criticism of this system? and what could be drawn out from that?"
Mid way through phase 2 you may interrupt and ask participants to draw lines of connection between their sticky notes to show drivers, forces, connections and pressures. You could ask something like "Are there some places in the map that push more and influence other areas more than others."
Systemic Design and Systems Mapping in Education System
Iceberg Case Study Example

Further Reading on Systemic Design
What is Systemic Design by Alex Ryan


